Prometheus
Contents
When working with a Kubernetes cluster, the moment inevitably comes when you need to have before your eyes the most complete information about what is happening in it. The values of CPU, RAM and traffic, both in the cluster as a whole, and in particular cases of containers, as well as the contents of their logs, all this must be kept before your eyes, preferably at the same time, in order, for example, to correlate data and find problems. This requires a flexible customizable system and we at Buildateam decided to stick with Prometheus + Grafana + Loki. In this article series, we’ll walk you through the process of deploying and configuring this bundle.
1. Creating ConfigMap
We will write the configuration of Prometheus and the Supervisor process manager in ConfigMap in order to mount it to the container in the future. Below you can see the contents of the resulting file.
apiVersion: v1
kind: ConfigMap
metadata:
name: prometheus
namespace: monitoring
data:
prometheus-yml: |+
# my global config
global:
scrape_interval: 15s # Set the scrape interval to every 15 seconds. Default is every 1 minute.
# A scrape configuration containing exactly one endpoint to scrape:
# Here it’s Prometheus itself.
scrape_configs:
# The job name is added as a label `job=<job_name>` to any timeseries scraped from this config.
– job_name: ‘prometheus’
static_configs:
– targets: [‘localhost:9090’, ‘10.60.15.183:9100’]
docker-run: |+
#!/bin/bash
echo “Starting Prometheus…”
service supervisor start
echo “Starting tail…”
tail -f /dev/stderr
supervisor-conf: |+
[program:prometheus]
command=/usr/local/bin/prometheus –config.file /etc/prometheus/prometheus.yml –storage.tsdb.path /var/lib/prometheus/ –web.console.templates=/etc/prometheus/consoles –web.console.libraries=/etc/prometheus/console_libraries
process_name=%(program_name)s_%(process_num)02d
user=prometheus
stdout_logfile=/var/log/out.log
stderr_logfile=/var/log/err.log
redirect_stderr=true
autostart=true
autorestart=true
startsecs=5
numprocs=1
supervisord-conf: |–
; supervisor config file
[unix_http_server]
file=/var/run/supervisor.sock ; (the path to the socket file)
chmod=0700 ; sockef file mode (default 0700)
[supervisord]
logfile=/var/log/supervisor/supervisord.log ; (main log file;default $CWD/supervisord.log)
pidfile=/var/run/supervisord.pid ; (supervisord pidfile;default supervisord.pid)
childlogdir=/var/log/supervisor ; (‘AUTO’ child log dir, default $TEMP)
; the below section must remain in the config file for RPC
; (supervisorctl/web interface) to work, additional interfaces may be
; added by defining them in separate rpcinterface: sections
[rpcinterface:supervisor]
supervisor.rpcinterface_factory = supervisor.rpcinterface:make_main_rpcinterface
[supervisorctl]
serverurl=unix:///var/run/supervisor.sock ; use a unix:// URL for a unix socket
; The [include] section can just contain the “files” setting. This
; setting can list multiple files (separated by whitespace or
; newlines). It can also contain wildcards. The filenames are
; interpreted as relative to this file. Included files *cannot*
; include files themselves.
[include]
files = /etc/supervisor/conf.d/*.conf
[inet_http_server]
port=127.0.0.1:9001
username=admin
password=admin
In the part devoted to prometheus-yml, a time parameter for collecting metrics is set, as well as the sources for obtaining these metrics. In this case, information is obtained from two sources every 15 seconds. One of the sources contains the metrics of prometheus itself, and the second address contains the node-exporter data. Node-exporter allows you to get a large amount of data about the cluster, so we recommend using it.
The docker-run file will launch Supervisor, which in turn will launch Prometheus when the container starts.
The supervisor-conf and supervisord-conf parts are the configuration of the task manager. The key field is the command field, which defines the parameters for launching Prometheus. In this field, you can set the databases used, the storage time of the metrics, the maximum size for storing the metrics, and much more.
2. Creating a Node-exporter image
To use the Node-exporter, we will also use the Supervisor process manager. Below you will find the Supervisor configuration file and startup script, which will be located in the config folder.
supervisor.conf :
[program:node-exporter] command=./node_exporter
process_name=%(program_name)s_%(process_num)02d
user=root
stdout_logfile=/var/log/out.log
stderr_logfile=/var/log/err.log
redirect_stderr=true
autostart=true
autorestart=true
startsecs=5
numprocs=1
supervisor-start.sh :
#!/usr/bin/env bash
echo “starting supervisor…”
service supervisor start
echo “Starting tail…”
tail -f /dev/stderr
Now that we have everything we need, let’s create a Dockerfile to create an image with Node-exporter.
Dockerfile :
FROM gcr.io/buildateam-52/debian-buster:latest
COPY config/ /
RUN apt-get -y update && apt-get -y install wget supervisor
RUN wget https://github.com/prometheus/node_exporter/releases/download/v1.1.0/node_exporter-1.1.0.linux-amd64.tar.gz
RUN tar xvfz node_exporter-*.*-amd64.tar.gz
RUN cp supervisor.conf /etc/supervisor/conf.d/
RUN chmod +x supervisor-start.sh
RUN ln node_exporter-1.1.0.linux-amd64/node_exporter ./node_exporterCMD ./supervisor-start.sh
Now you can build your image with Node-exporter, write your deployments and service for k8s and use Node-exporter on the cluster.
3. Creating a Prometheus image
The Dockerfile to build the Prometheus image will look like this:
FROM gcr.io/buildateam-52/debian-buster:latest
COPY config/ /
RUN apt-get -y update && apt-get -y install wget supervisor
RUN useradd -M -r -s /bin/false prometheus
RUN mkdir /etc/prometheus
RUN mkdir /var/lib/prometheus
RUN chown prometheus:prometheus /etc/prometheus
RUN chown prometheus:prometheus /var/lib/prometheusRUN wget https://github.com/prometheus/prometheus/releases/download/v2.24.1/prometheus-2.24.1.linux-amd64.tar.gz
RUN tar -xzf prometheus-2.24.1.linux-amd64.tar.gzRUN cp prometheus-2.24.1.linux-amd64/prometheus /usr/local/bin/
RUN cp prometheus-2.24.1.linux-amd64/promtool /usr/local/bin/
RUN chown prometheus:prometheus /usr/local/bin/prometheus
RUN chown prometheus:prometheus /usr/local/bin/promtool
RUN cp -r prometheus-2.24.1.linux-amd64/consoles /etc/prometheus/
RUN cp -r prometheus-2.24.1.linux-amd64/console_libraries/ /etc/prometheus/
RUN chown -R prometheus:prometheus /etc/prometheus/consoles
RUN chown -R prometheus:prometheus /etc/prometheus/console_libraries
CMD /usr/local/bin/docker-run
4. Using the resulting image
After creating the image, you can use it using the StatefulSet you see below.
apiVersion: apps/v1
kind: StatefulSet
metadata:
name: prometheus
namespace: monitoring
spec:
serviceName: prometheus-svc
replicas: 1
selector:
matchLabels:
app: prometheus
template:
metadata:
labels:
app: prometheus
spec:
containers:
– name: prometheus
image: gcr.io/buildateam-52/prometheus:latest
imagePullPolicy: Always
volumeMounts:
– name: prometheus-data
mountPath: /var/lib/prometheus/
subPath: prometheus-storage
– name: prometheus-config
mountPath: /etc/prometheus/prometheus.yml
subPath: prometheus-yml
– name: prometheus-config
mountPath: /etc/supervisor/supervisord.conf
subPath: supervisord-conf
– name: prometheus-config
mountPath: /etc/supervisor/conf.d/supervisor.conf
subPath: supervisor-conf
– name: prometheus-config
mountPath: /usr/local/bin/docker-run
subPath: docker-run
resources:
limits:
cpu: 0.6
memory: 600Mi
requests:
cpu: 0.3
memory: 300Mi
volumes:
– name: prometheus-data
persistentVolumeClaim:
claimName: prometheus-disk
– name: prometheus-config
configMap:
name: prometheus
defaultMode: 511
This StatefulSet will help you connect the configuration files described above, as well as mount the disk, which will not allow you to lose information in the event of a restart or re-creation of the container. Don’t forget to set up snapshot creation. For those who, like us, have chosen the Google Cloud Platform, the following steps will be relevant. Open the GCP console (https://console.cloud.google.com/), go to the Compute Engine section, then Snapshots, then click Create snapshot schedule. Here you can schedule snapshots for your drives.
5. Interface overview
In order to open the Prometheus interface, you need to create a Service that will open access to port 9090 of the pod. After you do this, go to the dedicated IP address. You should see the following image:
 Figure 1.1 Prometheus Interface
In order to check the connection to the sources of metrics, click on Status, then click Targets. If the Status column is green, then everything is ok.
 Figure 1.2 Targets status
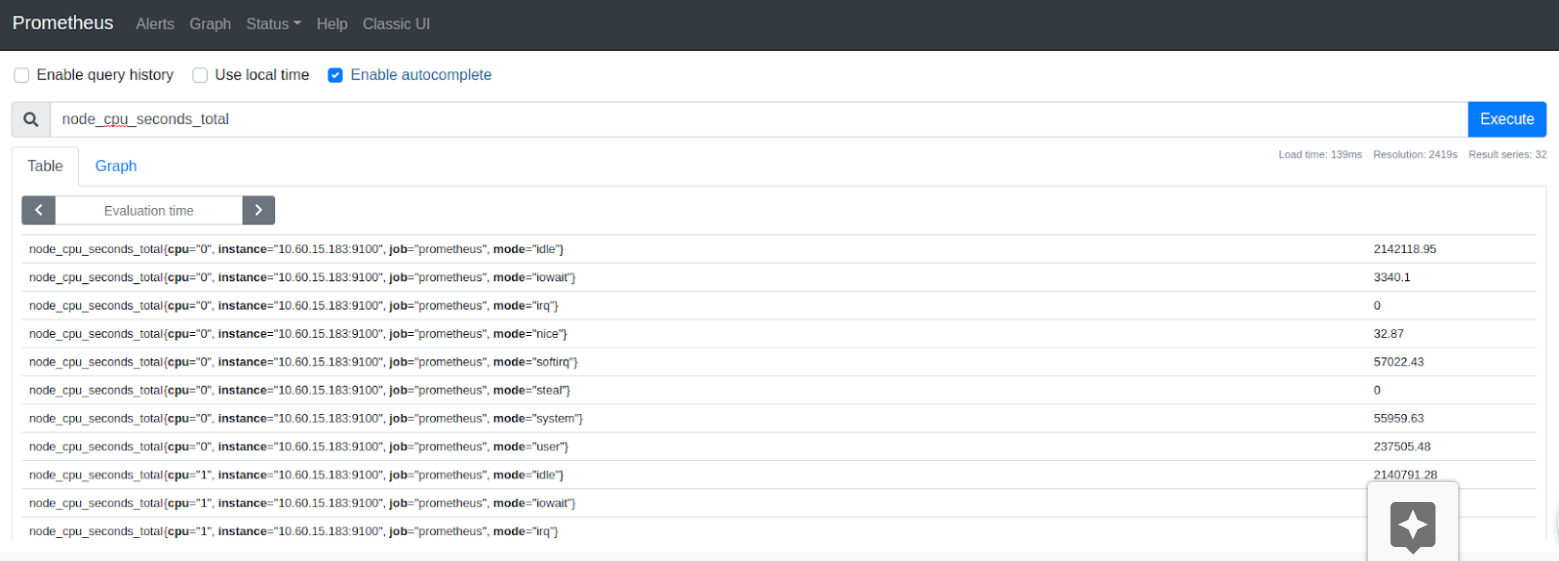
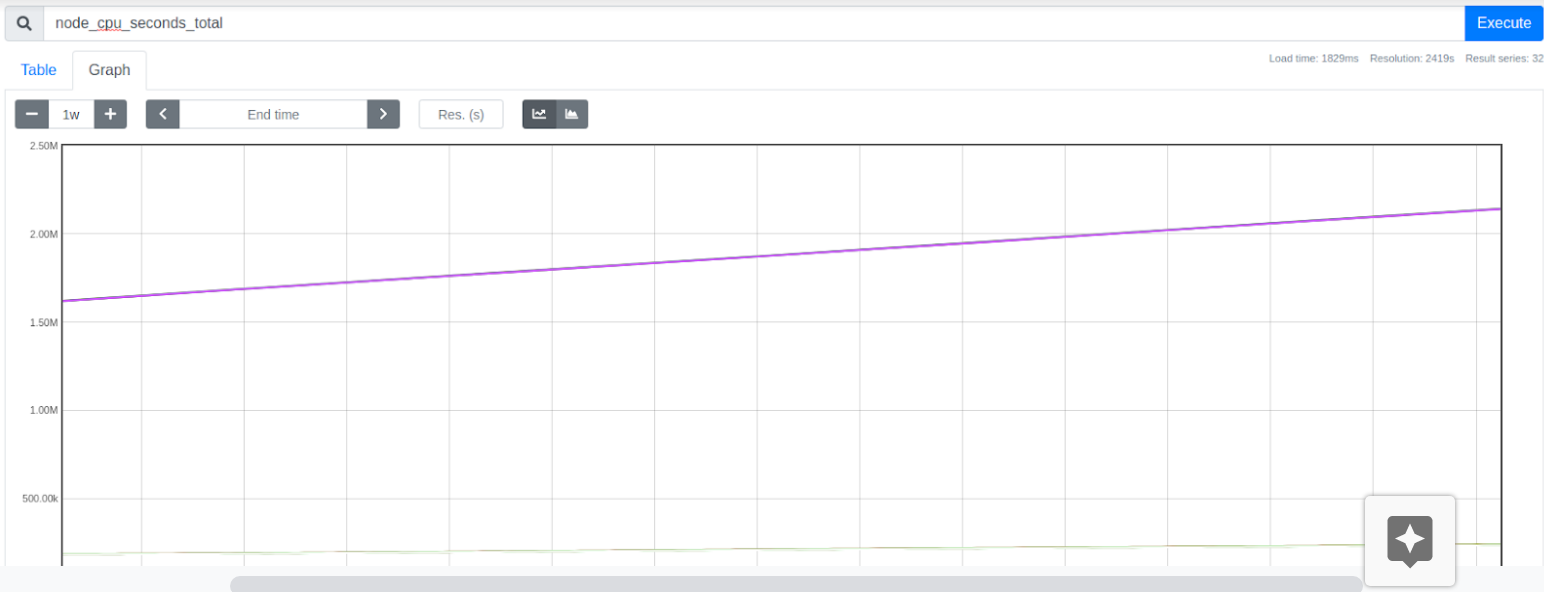
We can now take a look at the values obtained by Prometheus. To do this, click on Graph. And enter “node_cpu_seconds_total” in the search box. As a result, you will see a number of values, you can also switch to the Graph tab and see graphs showing the value of the metric for a specified period of time.
 Figure 1.3 Table of metric values
 Figure 1.4 Graph of metrics changes during the week
The inconvenience of using Prometheus is that each time you need to enter the necessary command to get the metric, which takes time, and also does not allow you to get a clear picture. It is in order to solve these problems that we need Grafana.
Read More:
Want to skip the hassle? We offer Managed Google Cloud Hosting.
Email us at hello@buildateam.io for an advice or a quote. Also feel free to check out Managed Google Cloud Hosting

