Grafana
Contents
- Creating ConfigMap
- Creating a Node-exporter image
- Using the resulting image
- Importing the first dashboard
In this part of the series, we’ll walk through the steps of imaging, configuring, deploying, and using the powerful monitoring tool Grafana. The work of Grafana is closely related to interaction with Prometheus (an example of the deployment of which we considered in the previous article), Loki (which we will discuss in the forthcoming article), as well as many other data sources, including GCP, AWS, Azure.
Creating ConfigMap
For Grafana to work, ConfigMap will contain only two parts, the first will contain the contents of the grafana.ini file, the second will contain the start script.
In view of the too large size of grafana.ini, here I will leave in it only one line containing the address with which it will be possible to enter the interface through the browser. Full file link is here (https://github.com/grafana/grafana/blob/main/conf/defaults.ini)
apiVersion: v1
kind: ConfigMap
metadata:
name: grafana
namespace: monitoring
data:
grafana-ini: |+
root_url = http://110.15.23.170/
docker-run: |–
#!/bin/bash
echo “Starting Grafana…”
service grafana-server startecho “Starting tail…”
tail -f /dev/stderr
Creating a Grafana image
Below you can see a Dockerfile that will create an image with the latest version of Grafana installed.
FROM gcr.io/buildateam-52/debian-buster:lates
RUN apt-get -y update && apt-get -y install wget apt-transport-https software-properties-common
RUN wget -q -O – https://packages.grafana.com/gpg.key | apt-key add –
RUN echo “deb https://packages.grafana.com/oss/deb stable main” | tee -a /etc/apt/sources.list.d/grafana.list
RUN echo “deb https://packages.grafana.com/oss/deb beta main” | tee -a /etc/apt/sources.list.d/grafana.list
RUN apt-get -y update && apt-get -y install grafana
RUN update-rc.d grafana-server defaults
CMD /usr/local/bin/docker-run
Using the resulting image
Now that we have the image and configuration file, we can create a StatefulSet file to deploy the image.
apiVersion: apps/v1
kind: StatefulSet
metadata:
name: grafana
namespace: monitoring
spec:
serviceName: grafana-svc
replicas: 1
selector:
matchLabels:
app: grafana
template:
metadata:
labels:
app: grafana
spec:
containers:
– name: grafana
image: gcr.io/buildateam-52/grafana:latest
imagePullPolicy: Always
volumeMounts:
– name: grafana-data
mountPath: /etc/grafana/
– name: grafana-config
mountPath: /etc/grafana/grafana.ini
subPath: grafana-ini
– name: grafana-config
mountPath: /usr/local/bin/docker-run
subPath: docker-run
resources:
limits:
cpu: 0.5
memory: 500Mi
requests:
cpu: 0.5
memory: 500Mi
volumes:
– name: grafana-data
persistentVolumeClaim:
claimName: grafana-disk
– name: grafana-config
configMap:
name: grafana
defaultMode: 511
As you can see in the file, it will help to connect the configuration file, as well as mount the disk, to store important data on it, so that in case of restarting or re-creating the container, you will not encounter a reset system. Don’t forget to set up snapshot creation. For those who, like us, have chosen the Google Cloud Platform, the following steps will be relevant. Open the GCP console (https://console.cloud.google.com/), go to the Compute Engine section, then Snapshots, then click Create snapshot schedule. Here you can schedule snapshots for your drives.
Don’t forget to create the Service with the same IP address you set in grafana.ini.
Importing the first dashboard
If you have successfully completed the previous steps, then now at the IP address (or domain) specified in the configuration file, you can contemplate the Grafana interface. After logging in, you will see the start page. Now you only need to follow a few steps to see any data.
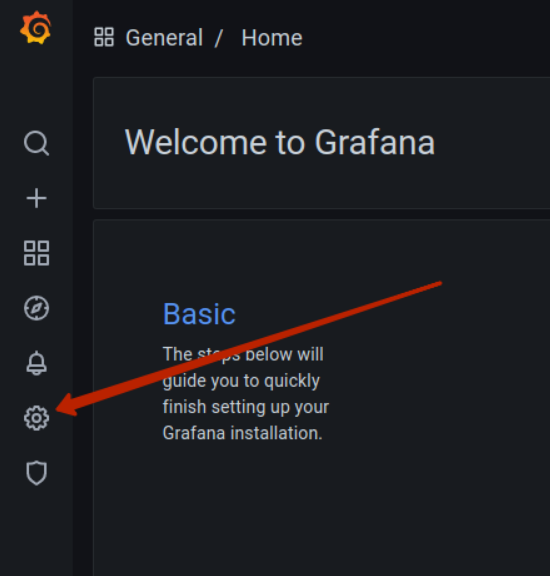
First, you need to connect the previously launched Prometheus to Grafana. To do this, click on the image of the gear located on the left panel, then click on the “Add data source” button.

Figure 2.1 Image of the gear
Select Prometheus from the list provided. On the page that opens, enter the name of your data source, and also specify its IP address. Then click on the “Save & test” button. If everything is done correctly, then the test connection will be successful and Prometheus will be saved as a data source.
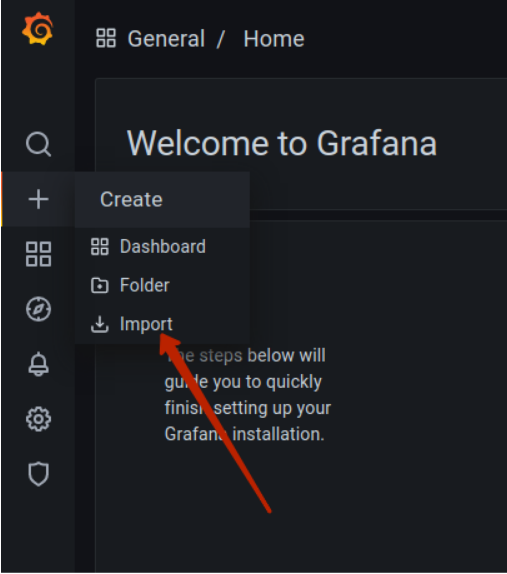
Secondly, you need to create or import a dashboard in which charts and information you need will be displayed. Here we will consider using a ready-made dashboard, information about which is available at the following link (https://grafana.com/grafana/dashboards/1860). After following the link you should click “Download JSON”. The downloaded JSON file describes the appearance, as well as expressions that allow you to get the desired metrics and manipulate them. To import a JSON file into Grafana, you need to hover over the plus image located on the left panel and select “Import” from the drop-down menu.

Figure 2.2 Import button location
On the page that opens, click on the “Upload JSON file” button, specify the path to the downloaded file, and then select the data source (Prometheus). Finally, the first dashboard is loaded.
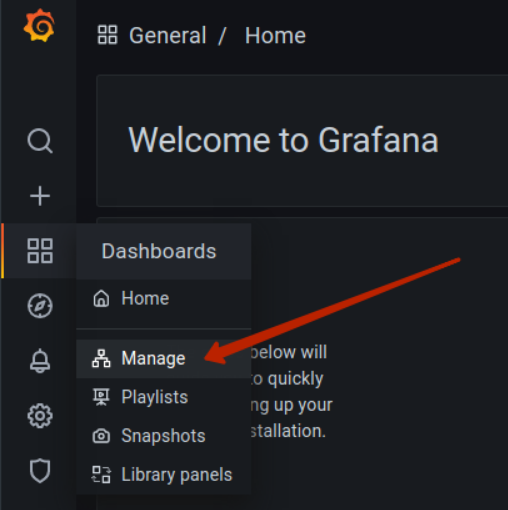
To open the dashboard, move the cursor over the image of the four squares located on the left panel. Select “Manage” and then click on the name of the new dashboard (Node Exporter Full).

Figure 2.3 Manage button location
Here you can see charts and other indicator systems that will tell you about the state of affairs in your cluster thanks to node-exporter.
But since numerical values are not the only thing that may be useful for us to know about the state of affairs in the cluster, in the next article we will pay attention to the analog of Prometheus in the field of logging – Loki.
Read More:
Want to skip the hassle? We offer Managed Google Cloud Hosting.
Email us at hello@buildateam.io for an advice or a quote. Also feel free to check out Managed Google Cloud Hosting

