Loki
Contents
- Creating ConfigMap
- Creating a Loki image
- Using the resulting image
- Create your application image with Promtail
- Connecting Loki to Grafana
- Conclusion
So, in this article we will deploy and consider a useful monitoring tool in the field of logging – Loki, as well as connect it to Grafana. At our company, we use Loki, in particular, to get logs from our application written in Node.js (Custom Product Builder). And in the course of the article, we will look at how we can display logs in Grafana using Promtail and Loki. Protail, in fact, is an analogue of the metrics exporter for Prometheus, it only transfers logs to Loki. Let’s move on to creating configuration files and an image for Loki.
Creating ConfigMap
Just as we did earlier, we will create a ConfigMap containing the Loki configuration and the Supervisor process manager.
apiVersion: v1
kind: ConfigMap
metadata:
name: loki
namespace: monitoring
data:
loki-config: |+
auth_enabled: false
server:
http_listen_port: 3100
ingester:
lifecycler:
address: 127.0.0.1
ring:
kvstore:
store: inmemory
replication_factor: 1
final_sleep: 0s
chunk_idle_period: 1h # Any chunk not receiving new logs in this time will be flushed
max_chunk_age: 1h # All chunks will be flushed when they hit this age, default is 1h
chunk_target_size: 1048576 # Loki will attempt to build chunks up to 1.5MB, flushing first if chunk_idle_period or max_chunk_age is reached first
chunk_retain_period: 30s # Must be greater than index read cache TTL if using an index cache (Default index read cache TTL is 5m)
max_transfer_retries: 0 # Chunk transfers disabled
schema_config:
configs:
– from: 2020-10-24
store: boltdb-shipper
object_store: filesystem
schema: v11
index:
prefix: index_
period: 24h
storage_config:
boltdb_shipper:
active_index_directory: /opt/loki/boltdb-shipper-active
cache_location: /opt/loki/boltdb-shipper-cache
cache_ttl: 24h # Can be increased for faster performance over longer query periods, uses more disk space
shared_store: filesystem
filesystem:
directory: /opt/loki/chunks
compactor:
working_directory: /opt/loki/boltdb-shipper-compactor
shared_store: filesystem
limits_config:
reject_old_samples: true
reject_old_samples_max_age: 168h
chunk_store_config:
max_look_back_period: 0s
table_manager:
retention_deletes_enabled: false
retention_period: 0s
ruler:
storage:
type: local
local:
directory: /opt/loki/rules
rule_path: /opt/loki/rules-temp
alertmanager_url: http://localhost:9093
ring:
kvstore:
store: inmemory
enable_api: true
supervisor_conf: |+
[program:loki]
command=/usr/local/bin/loki -config.file=/etc/loki/loki-config.yaml
process_name=%(program_name)s_%(process_num)02d
user=root
stdout_logfile=/var/log/out.log
stderr_logfile=/var/log/err.log
redirect_stderr=true
autostart=true
autorestart=true
startsecs=5
numprocs=1
docker-run: |–
#!/bin/bash
echo “Starting Loki…”
service supervisor start
echo “Starting tail…”
tail -f /dev/stderr
The Loki-config presented in the file is standard, so we will not dwell on it in detail, supervisor_conf will allow you to start Loki using loki-config. Docker-run will start Loki at the start of the container.
Creating a Loki image
Below you can see a Dockerfile that will create an image with Loki version 2.1.0 installed.
FROM gcr.io/buildateam-52/debian-buster:latest
RUN cd /usr/src/
RUN apt-get -y update && apt-get -y install wget supervisor unzip
RUN wget https://github.com/grafana/loki/releases/download/v2.1.0/loki-linux-amd64.zip
RUN unzip loki-linux-amd64.zip
RUN chmod a+x loki-linux-amd64
RUN mv loki-linux-amd64 /usr/local/bin/loki
RUN mkdir /etc/loki
RUN mkdir /opt/lokiCMD /usr/local/bin/docker-run
Using the resulting image
We can now compose a StatefulSet file to use the Loki image. You can see its contents below.
apiVersion: apps/v1
kind: StatefulSet
metadata:
name: loki
namespace: monitoring
spec:
serviceName: loki-svc
replicas: 1
selector:
matchLabels:
app: loki
template:
metadata:
labels:
app: loki
spec:
containers:
– name: loki
image: gcr.io/buildateam-52/loki:2.1.0
imagePullPolicy: Always
volumeMounts:
– name: loki-data
mountPath: /opt/loki/
subPath: loki
– name: loki-config
mountPath: /etc/loki/loki-config.yaml
subPath: loki-config
– name: loki-config
mountPath: /etc/supervisor/conf.d/supervisor.conf
subPath: supervisor_conf
– name: loki-config
mountPath: /usr/local/bin/docker-run
subPath: docker-run
resources:
limits:
cpu: 0.4
memory: 400Mi
requests:
cpu: 0.2
memory: 200Mi
volumes:
– name: loki-data
persistentVolumeClaim:
claimName: loki-disk
– name: loki-config
name: loki
defaultMode: 511
Create your application image with Promtail
In order for Promtail to be able to receive the logs of your application, you must install it into your image, and also output the logs to a file.
To add Promtail to your application image, add these 3 instructions to your Dockerfile.
curl -s https://api.github.com/repos/grafana/loki/releases/latest | grep browser_download_url | cut -d ‘”‘ -f 4 | grep promtail-linux-amd64.zip | wget -i –
unzip promtail-linux-amd64.zip
mv promtail-linux-amd64 /usr/local/bin/promtail
In addition, add the Promtail folder to the Dockerfile directory, which will store the necessary configuration files, you can see their contents below.
promtail.yml:
server:
http_listen_port: 9080
grpc_listen_port: 0
positions:
filename: /tmp/positions.yaml
clients:
– url: http://34.73.101.230:80/loki/api/v1/push
scrape_configs:
– job_name: app-cpb-stage
static_configs:
– targets:
– localhost
labels:
job: app-cpb
__path__: /tmp/app.log
The url field contains the path to your Loki, in the specified line you need to spoof the IP address (and port, if necessary)
The value of the job field will later be displayed in the list of available sources in Grafana, and __path__ will indicate the path to the file that stores the logs of your application.
The folder will also contain configuration files for Supervisor.
supervisor.conf:
[program:promtail]
command=/usr/local/bin/promtail -config.file=/etc/promtail/promtail.yaml
process_name=%(program_name)s_%(process_num)02d
user=root
stdout_logfile=/var/log/out.log
stderr_logfile=/var/log/err.log
redirect_stderr=true
autostart=true
autorestart=true
startsecs=5
numprocs=1
supervisor-start.sh
#!/usr/bin/env bash
echo “starting supervisor…”
service supervisor start
echo “starting server…”
npm run start
Now you will need to place these files in the following directories:
promtail.yaml => /etc/promtail/promtail.yaml
supervisor.conf => /etc/supervisor/conf.d/supervisor.conf
Don’t forget to make supervisor-start.sh is Now you will need to place these files in the following directories:
promtail.yaml => /etc/promtail/promtail.yaml
Don’t forget to make supervisor-start.sh executable.
Connecting Loki to Grafana
And now we are approaching the final stage. We need to connect Loki to Grafana and see our first logs. To do this, click on the image of the gear located on the left panel, then click on the “Add data source” button. Select Loki from the list provided. On the page that opens, enter the name of your data source, and also specify its URL. Then click on the “Save & test” button. If everything is done correctly, then the test connection will be successful and Loki will be saved as a data source.
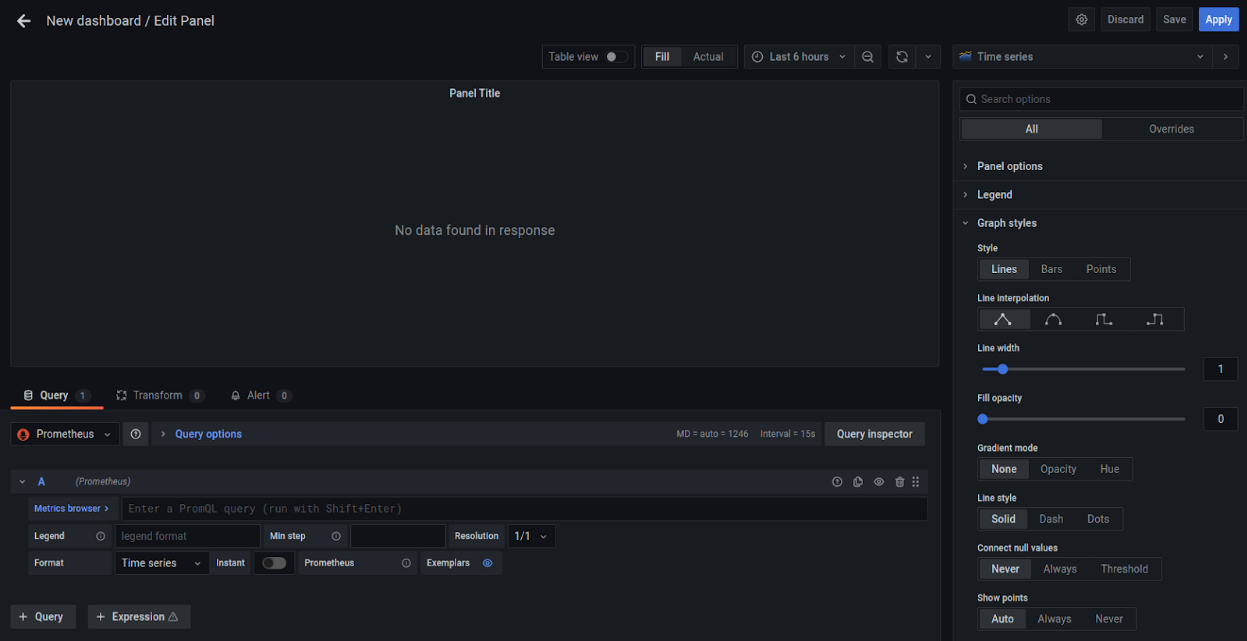
Next, we go to the Manage of the Dashboards item and click on the New Dashboard button, then select Add an empty panel. In Figure 3.1, you can see the result of the previous steps.

Figure 3.1 Settings a new panel
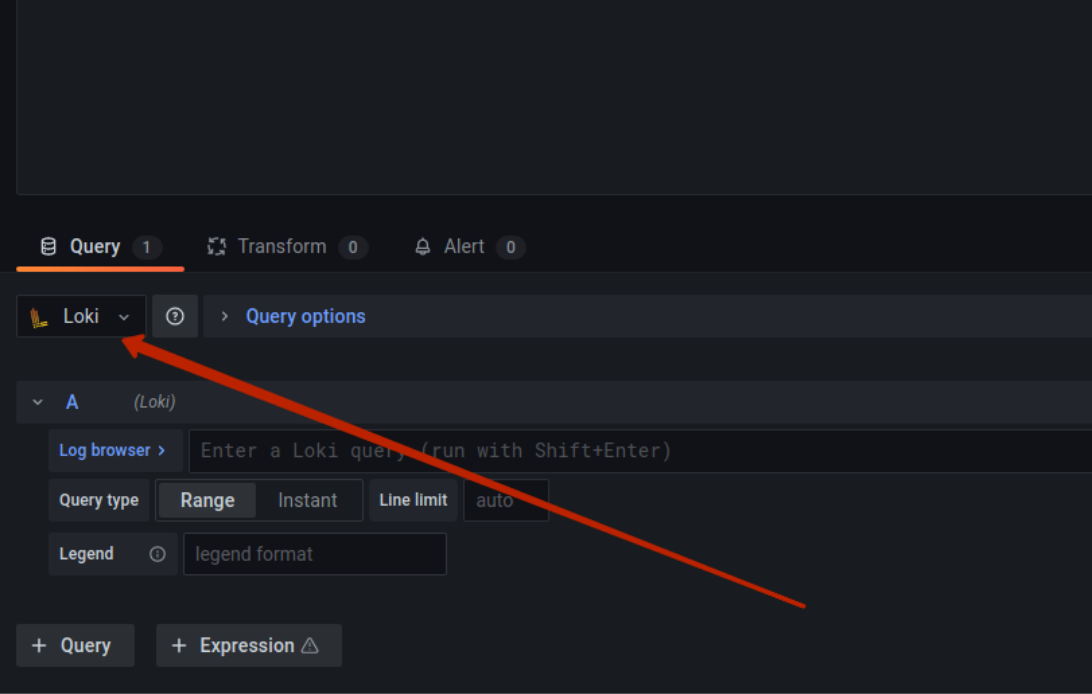
You have to choose Loki data source.

Figure 3.2 Set Loki by data source
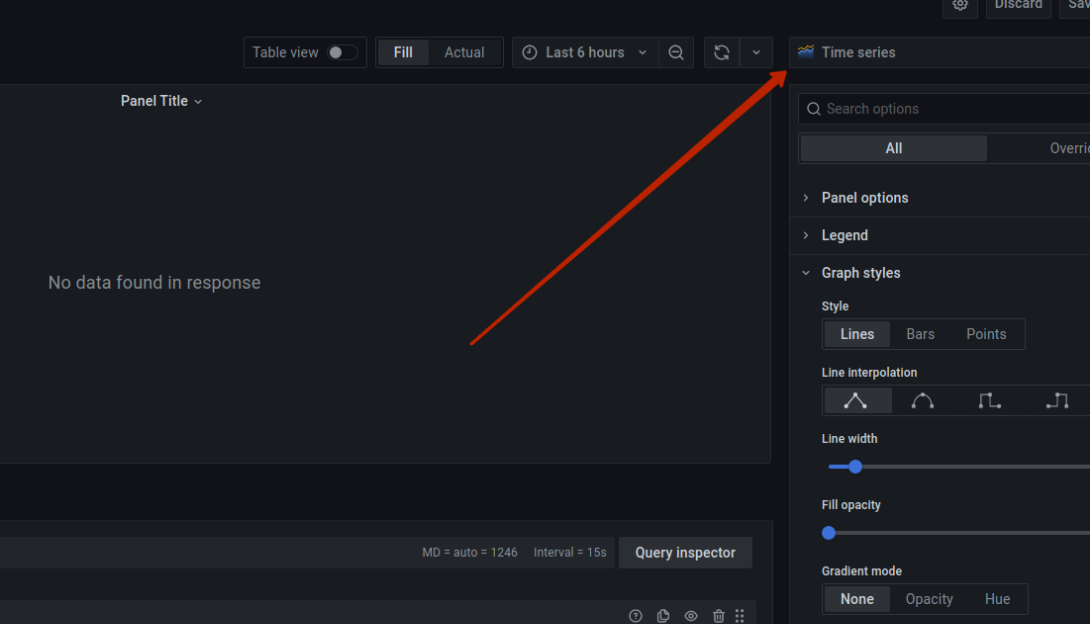
Now click on the Log browser and find the job name that you specified in the Promtail configuration. Finally, click on the Time series dropdown menu and then select Logs.

Figure 3.3 Time series location
After the manipulations are done manipulations, you will see the logs of your application.
Conclusion
In this series of articles, we’ve covered the sequence of steps required to deploy what is essentially a minimal monitoring system. Undoubtedly, the information in the articles is not exhaustive, since the tools that were used have a very wide range of applications, but we hope that you got a general understanding of the process and were able to learn something new.
Read More:
Want to skip the hassle? We offer Managed Google Cloud Hosting.
Email us at hello@buildateam.io for an advice or a quote. Also feel free to check out Managed Google Cloud Hosting

